Graphs bring enhanced navigation, visibility, and productivity to your distribution center operation.
The addition of the WMSei Dashboards module allows a manager to quickly assess what is happening in daily operations as well as to evaluate how the business is performing compared to industry benchmarks.
Included with this module are several pre-defined dashboards designed specifically for warehouse operations managers and supervisors. Below are examples of some of these.
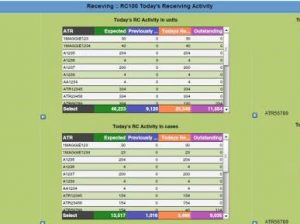
Receiving
This Dashboard gives the receiving supervisor a view into expected receipts for planning the day’s labor for receiving and putaway tasks.
Storage Management
Monitors warehouse and slot capacity to quickly identify opportunities for consolidation and provides drill downs to inventory details as needed.
Labor Management
Measures picking productivity against standards by picker; and compares against day-to-day, week-to-week, or month-to-month activity.
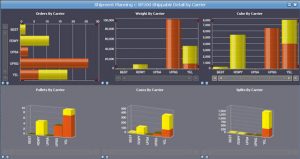
Shipment Planning
Displays, by Carrier, a graphical view of the day’s orders by weight, cube, pallet, case, and splits.
RF Management
Picking supervisors are able to release work to the floor and adjust priorities quickly as they monitor picking progress with up-to-the-minute views of workload and work progress.
Shipping
Shipping supervisors can monitor the status of trailers and loading docks. Monitoring the status of a wave, they are able to expedite loading and trailer departure.
Operations Management
Managers can monitor critical operation metrics to respond to business changes and performance.