Bottoms Up
Bottoms Up – A Better Way to Look at Your Data
Spend less time sifting through data and more time optimizing operations. Today’s systems provide mountains of data. You need a fast way to get to the data intelligence that impacts the success of your operation. You need a way to become smarter quicker, so you can make smarter choices—quicker.
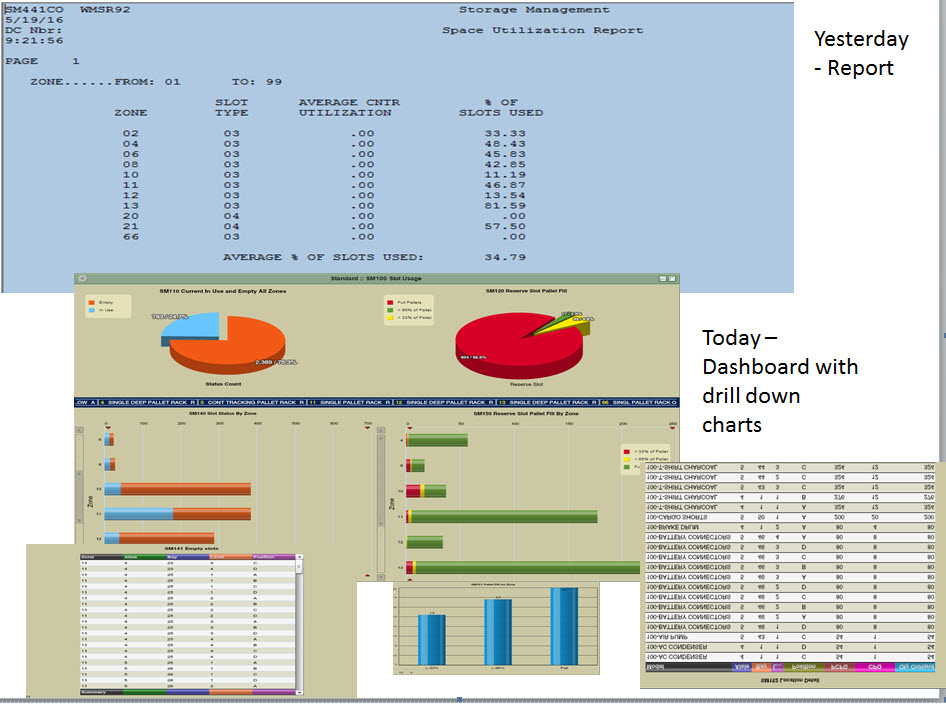
“Back in the day” long reports and data dumps were the norm: lines and lines of data summarized in sub- and grand- totals; pages and pages of numbers. Finding what you needed was frequently tedious and time consuming, often requiring manual manipulation and calculations to generate the desired actionable data.
Fast forward to today. Now some simple visualization tools enable you to go the other way—from the total to the detail. A dashboard summary lets you quickly determine whether you are at, below, or above expectation; within or outside tolerance. And, their intuitive nature enables their use by a broader audience. If you need to research the “why,” a couple of quick clicks will drill you into the detail—much quicker, more efficient, and much more sensible—leaving you a happy hour to do something else!
WMSei User Quote
“Management loves to see the high level, real time (we set the dashboards to refresh every 5 minutes) statistics, and then the ability to drill down to see more detailed information. It really helps them see many different areas of the warehouse on one dashboard. And when they want more information, a click of the chart opens up more details to see if anything needs to be addressed in certain areas. Before dashboards, they would have to constantly run query after query to see the information they wanted to see. Dashboards allows us to take up to 8 queries and have them on one screen refreshing every 5 minutes.” Ken Bell, Manager – Operation Support at Follett
Let’s Talk!
617-510-0081
Our highly-trained tech support team will be happy to answer your questions. Call us today!